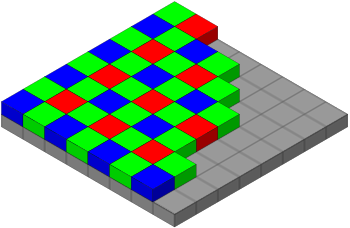
使用 Bayer Pattern ,对图像数据进行转换。

Introduction
As I eluded to in the last lecture, assignment 2 is going to be about
demosaicing. Demosacing algorithms are what are used to produce “normal”
looking color images from camera sensors with color filter arrays installed on
them. It will consist of 3 parts, each with it’s own goal
Overview
- Part A: Goal is to get comfortable with the image format used for the course, along with using this website as a “viewer”. You will stack the output produced by the camera sensor into a grid, and assign each value a color by referencing the bayer color filter pattern and the location of the intensity value in the grid.
- Part B: Goal is to perform simple demosaicing and combine 4 neighboring intensity values of their respective color into one RGB color; and do the same for all pixels.
- Part C: Goal is to perform a slightly more complicated demosaicing algorithm, that involves a “sliding window”. You will notice how depending on the choice of demosaicing algorithm the resolution of the image we produce differs.
Note that you are not to use any library outside of what is available by
default in the programming language you choose.
More details
- Just like before there are 3 text files for you, you won’t have to change any code or redo any work for each except for change the width and the height numbers. You just have to run your code for each text file.
- You will be given a list of intensity values, just like before; but this time instead of representing raw data produced by each photodiode, each intensity value that is scaled up to 0-255 to match 8-bit color.
- For the previous assignment, the we treated each value, equally, without think about color.
- This time around, we will assume that each photodiode has a color filter installed in front of it. You can figure out which color filter it is by consulting the bayer color filter array pattern. There are multiple GIFs on this page that also serve as a reference for the bayer pattern.
- The _easy and the _medium images are meant to by 256 by 256 pixels.
- According to the Bayer pattern, 4 photodiodes combine to produce a single color pixel. Meaning you are supplied with 256 256 4 values.
Output Format
- As an “output” for each Part of the assignment, you will be creating a text file using the program you write. Each part is going to ask of you to create an image, and each image will be in this following format –
- The first line in the file will be RGB to represent that the image uses the RGB colorspace. RGB will be followed by a newline \n, so - RGB\n.
- The second line will be a number representing the height of the image in pixels, so 256\n for an image consisting of 256 pixels.
- The third line in the image would be the width of the image in pixels, so 512\n for a 512 pixel wide image.
- From the fourth line onwards you will have the RGB color for each pixel, so 144 72 44\n for the color rgb(144, 72, 44). You will have as many lines as pixels in your image.
You can use the “Viewer” section of this website to look at these images.
Submission Format
You will submit as a zip –
- Your text file that was provided as input.
- Source code of your program that implements the solution.
- Output files produced by your program.
- Screenshot of these output files as viewed in the viewer.
Part A
- The first task is simply to convert the list of intensity values given to the above image format, take a screenshot of the images using the supplied binary, and attach both the image text files and the screenshots and submit.
- You are to also describe, briefly, what you see in the image and why you think it looks the way it does.
- Last time around you were given a list of voltage values, which you stacked (either to make a CSV file, ASCII art, or something else), like so - Stacking
- Those intensity values represented the output of a grayscale camera sensor, without color. This time around, the images have a bayer color filter array in front of them, like so - colored
- Meaning each intensity value now has an associated color.
- Your task is to first stack the intensity values in a grid, so that you can use the bayer pattern to figure out which value pertains to which color.
- Once you’ve done that, you’ll turn each value into an RGB color. For instance, the 83 when meant for a red color turns into 83 0 0; for a green color turns into 0 83 0 and for a blue color turns into 0 0 83.
- Once you’ve figured out the RGB value for each intensity value, write it out to an output file in the format mentioned above.
- In these animations, I’ve shown a camera sensor with 16 photodiodes giving you 16 intensity values, and I’ve stacked them into a 4 by 4 grid so that I can apply the bayer pattern to tell me which intensity value belongs to what color.
- In the _easy and the _medium text files you are given, there are 262,144 intensity values, which will be stacked in a 512 by 512 grid –
- We know that the _easy image is 256 pixels by 256 pixels.
- We know from the Color acquisition lecture that the color from each pixel is derived from 4 photodiodes.
- We know that these photodiodes that produce a single colored pixel are arranged in a 2 by 2 grid.
- Meaning that if the image is 256 by 256 pixels, then the camera sensor would have a grid of 256 2 by 256 2 photodiodes giving us a 512 by 512 grid.
An example
- Assume a 2 by 2 pixel image.
- The sensor would have 4 by 4 photodiodes, producing 4 * 4 intensity values.
- Let’s say those values are - [1, 2, 3, 4, 5, 6, 7, 8, 9, 10, 11, 12, 13, 14, 15, 16]
- You stack them in a grid to produce
- Once you’ve done that, you can use the bayer pattern to realise that 1 is the intensity for the color blue, 2 is for green, 3 is for blue again, and 4 is for green again. For the next row, the patten tells us that 5 belongs to green, 6 belongs to red, so on and so forth.
- This would produce the following file, according to the format described above–
- We used 4 pixels as the height for the image, and 4 pixels as the width, because we’re not combining the individual intensities into color yet, so a 4 by 4 photodiode grid produces a 4 by 4 image. When we do part B, we’ll actually combine the intensities, and we’ll produce a 2 by 2 image instead.
Do make sure the resolution you enter in the file properly corresponds to the
number of pixels in the output image
Part B
- The second part is where you will actually perform the demosaicing, basically, this –
- You will be “combining” the intensity for 4 photodiodes into 1 by doing this –
- Again, take a screenshot of the image using the Viewer, and attach both the image file and the screenshot and submit.
Do make sure the resolution you enter in the file properly corresponds to the
number of pixels in the output image
Part C
- This time around you will be doing this instead –
- This is a little tricky, and you’ll have to spend some time thinking about how the colors are being combined and planning how you write the algorithm.
- Again, take a screenshot of the image using the Viewer, and attach both the image file and the screenshot and submit.
Do make sure the resolution you enter in the file properly corresponds to the
number of pixels in the output imag


